The Essential Framework of Market Liquidity
At the core of every financial ecosystem lies the critical interplay between buy side liquidity and sell side liquidity – the foundational elements that enable efficient price discovery and market functioning. These opposing yet complementary forces create the essential infrastructure that facilitates transactions across all asset classes, from equities and bonds to foreign exchange and derivatives. Understanding the intrinsic nature of buyside liquidity and sellside liquidity provides crucial insight into how modern financial markets operate at their most fundamental level.
Buy Side Liquidity: The Demand-Side Engine
Buy side liquidity represents the aggregate demand within financial markets, comprising the full spectrum of purchase orders waiting to be executed. This liquidity exists in various forms, from visible limit orders on exchange order books to hidden institutional interest in dark pools liquidity venues. The concentration of buy side liquidity tends to form around psychologically significant price levels, technical analysis reference points, and areas where fundamental valuation metrics suggest attractive entry points for long-term investors.
Market microstructure research reveals that buy side liquidity follows distinct patterns of accumulation, often clustering around round-number price levels and previous high-volume nodes. These liquidity zones serve as natural gathering points for market participants with purchasing intent, creating reservoirs of potential demand that can be tapped when certain price thresholds are reached. The depth and resilience of buy side liquidity often determines how smoothly markets can absorb large sell orders without experiencing disruptive price movements.
Sell Side Liquidity: The Supply-Side Counterbalance
Sell side liquidity constitutes the mirror image of its buy side counterpart, representing the totality of sell orders available across trading venues. This includes everything from individual investor sell limits to massive institutional block offerings. Like buy side liquidity, sell side liquidity tends to concentrate around key technical levels, valuation boundaries, and areas where previous market activity has established significant supply.
The distribution of sell side liquidity plays a crucial role in determining how markets process large buy orders. Robust sell side liquidity prevents excessive price spikes when demand surges, while inadequate sell side liquidity can lead to dramatic price movements as buyers compete for limited available supply. Market makers and liquidity providers constantly monitor these sell side liquidity pools to ensure they can fulfill their role in maintaining orderly markets.
The Dynamic Equilibrium of Market Liquidity
The continuous interaction between buy side and sell side liquidity creates the dynamic equilibrium that characterizes healthy financial markets. This equilibrium constantly adjusts to reflect changing market conditions, with liquidity providers serving as crucial intermediaries who help bridge temporary imbalances between buyers and sellers.
The quality of market liquidity – measured by metrics such as bid-ask spreads, depth of order books, and price impact of trades – depends fundamentally on the robustness of both buy side and sell side liquidity. Market regulators pay close attention to these liquidity metrics, as they serve as important indicators of overall market health and resilience.
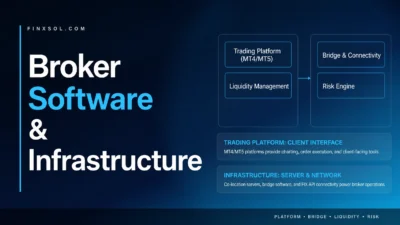
Institutional Infrastructure Supporting Liquidity
Modern financial markets have developed sophisticated infrastructure to support and enhance both buy-side and sell side liquidity. This includes:
- Electronic trading platforms that aggregate liquidity from multiple sources
- Dark pools that allow large institutions to trade without immediately impacting market prices
- Algorithmic trading systems designed to minimize market impact when executing large orders
- Market maker programs that provide continuous liquidity for less-traded instruments
These institutional mechanisms work together to ensure that sufficient liquidity exists on both sides of the market, even during periods of stress or unusually high trading volume.
The Critical Role of Liquidity in Market Efficiency
The presence of robust buy side and sell side liquidity contributes significantly to overall market efficiency by:
- Reducing transaction costs for all participants
- Enabling accurate price discovery
- Minimizing the market impact of large trades
- Providing continuous pricing even during volatile conditions
- Supporting fair and orderly markets
Market participants ranging from individual investors to large institutions all benefit from this liquidity infrastructure, though they may interact with it in different ways depending on their size and trading objectives.
Conclusion: The Bedrock of Financial Markets
Buy-side and sell-side liquidity together form the essential foundation upon which all financial market activity rests. These fundamental forces facilitate the smooth functioning of capital markets, enable efficient price discovery, and support the countless transactions that occur daily across global exchanges. Understanding these core liquidity concepts provides valuable insight into the inner workings of financial systems, from the smallest retail trades to the largest institutional transactions.
For organizations seeking to deepen their understanding of market liquidity dynamics and optimize their interaction with financial markets, FINXSOL offers comprehensive liquidity Consulting. Our institutional-grade resources provide valuable perspective on navigating today’s complex liquidity landscape.
Buys Side and Sell Side Liquidity Trading FAQs
Sell-side liquidity refers to the concentration of pending sell orders (stop losses, limit orders, or institutional positions) that market makers and large players target to fuel price movements. In the ICT trading methodology, this is often called liquidity pools or market liquidity zones—areas where price is likely to reverse or accelerate due to order execution. Key aspects of sell-side liquidity include stop liquidity hunting where institutional traders trigger retail stop-loss orders to move price, liquidity voids which are gaps where low order flow exists leading to rapid price shifts, and order blocks liquidity which are zones where banks place large sell orders creating future liquidity grabs. Understanding sell-side liquidity helps traders anticipate market reversals and breakouts, a core principle in smart money trading.
Identifying sell-side liquidity zones requires analyzing price action, order flow, and market structure. Here’s how professional traders spot these levels: Liquidity Levels Above Swing Highs/Lows where price often sweeps past key highs (for sell-side) or lows (for buy-side) to trigger stops before reversing. Volume Profile & Market Depth where high-volume nodes (VPOCs) indicate institutional interest. ICT Concepts like liquidity voids where price moves rapidly through thin order books and Fair Value Gaps (FVGs) which are imbalance zones where liquidity is absorbed. Order Blocks which are previous consolidation areas where banks likely placed sell orders. Tools like footprint charts, volume spread analysis (VSA), and Fibonacci retracements help confirm these zones.
While sell-side liquidity refers to clusters of sell orders (often targeted in stop-loss hunting), buy-side liquidity represents buy orders that institutions use to enter positions. Key Differences: Order Type – Pending sell stops vs pending buy stops. Price Movement – Sweeps highs before dropping vs sweeps lows before rallying. ICT Concept – Liquidity grabs vs absorption zones. Institutional Use – Used to trigger retail stops vs used to accumulate positions. Understanding both helps traders predict liquidity-driven reversals and align with bank trading strategies.
To detect sell-side liquidity, traders use: Volume Profile which identifies high-volume zones where liquidity pools form. Market Depth (DOM) which shows real-time sell order clusters. Footprint Charts which reveals aggressive selling (large red bars). Fibonacci Expansion which highlights where liquidity sweeps may occur. ICT’s Liquidity Runs Concept where price often revisits old highs/lows to trigger stops. Combining these with price action liquidity zones improves accuracy in spotting institutional traps.
Banks and hedge funds exploit sell-side liquidity to trigger retail stops by pushing price above key levels to force liquidations. They execute large orders by splitting big sell orders into smaller chunks near liquidity zones. They create false breakouts where fakeouts above resistance lure buyers before reversing. This aligns with ICT’s liquidity void theory, where price moves sharply after absorbing orders.
Buy Side Liquidity (BSL) refers to the concentration of resting buy orders (limit orders, stop losses, and pending entries) that institutional traders (smart money) target to trigger price movements. Unlike Sell Side Liquidity (SSL), which involves sell orders, BSL is often found at swing lows, previous day/week/month lows (PDL/PWL/PML), and below key support levels.
Market makers and large players hunt BSL to trigger stop losses of retail traders (liquidity sweeps), fill large institutional orders at optimal prices, and reverse markets after liquidity is absorbed (ICT Liquidity Concepts).
Key Indicators of BSL include liquidity voids (Fair Value Gaps – FVG), break of structure (BOS) below support, and change of character (CHOCH) after liquidity grab. For advanced strategies, traders use TradingView liquidity indicators or track order blocks to anticipate where BSL is hidden.
Identifying BSL requires analyzing price action, order flow, and institutional footprints. Here’s a step-by-step method:
- Mark Key Swing Lows – Previous Day Low (PDL), Previous Week Low (PWL), and Monthly Lows (PML).
- Track Stop Loss Clusters – Retail traders often place stops below swing lows.
- Watch for Liquidity Sweeps – A sharp drop below support (fakeout) before reversal (Stop Loss Hunting).
- Fair Value Gaps (FVG) – Unfilled imbalances that attract price returns.
- Volume Analysis – High volume at lows confirms institutional interest.
Best Timeframes:
- Intraday: 5M/15M for liquidity grabs
- Swing Trading: 1H/4H for major BSL zones
Example: If price breaks below PDL but quickly reverses, it signals BSL absorption (Market Maker Liquidity Hunting).
| Factor | Buy Side Liquidity (BSL) | Sell Side Liquidity (SSL) |
|---|---|---|
| Location | Below support (swing lows, PDL, PWL, PML) | Above resistance (swing highs, PDH, PWH, PMH) |
| Purpose | Triggers long liquidations & short entries | Triggers short liquidations & long entries |
| Institutional Use | Used to fill large buy orders cheaply | Used to fill large sell orders at peak prices |
| Price Reaction | Reversal upward after sweep (BOS) | Reversal downward after sweep (BOS) |
Smart Money Concept (SMC): BSL = Bullish reversal zone, SSL = Bearish reversal zone.
Institutional traders (ICT methodology) use BSL to manipulate retail traders by pushing price below support to trigger stops before reversing (Liquidity Grab Trading Strategy), accumulate positions by buying at discounted prices after sweeping liquidity, and create Fair Value Gaps (FVG) leaving imbalances that price must revisit.
ICT Liquidity Concepts for BSL:
- Liquidity Sweep: A false breakdown below PDL before a rally.
- Break of Structure (BOS): Confirms trend reversal after liquidity is taken.
- Mitigation Blocks: Zones where institutions re-enter trades.
Example: If EURUSD drops below PDL but closes back above, it indicates BSL was taken, and a bullish reversal is likely.
Retail traders often get trapped in liquidity hunts. Here’s how to avoid it:
- Avoid Placing Stops at Obvious Levels – Don’t set stops exactly below PDL/PWL.
- Use Hidden Liquidity Zones – Place stops beyond recent swing points.
- Wait for Confirmation – Don’t enter until price reclaims structure (CHOCH).
- Trade with Limit Orders – Enter on retests instead of market orders.
Best Indicators for Protection:
- Volume Profile – Confirms real institutional interest.
- Liquidity Zones Indicator (TradingView) – Highlights hidden BSL.
- Market Structure Shift (MSS) – Only trade after BOS confirms reversal.